GitHub Actions is the modern standard of CI/CD for both indie hackers & enterprises. With Actions one can achieve practically anything in a very easy and declarative way whether it be running tests on your code, deploying your production bundles, or even executing some code health checks or AI PR reviews!
GitHub Actions due to their declarative nature could be written by not only DevOps experts but also by frontend & backend engineers. One thing that you will immediately notice though as a person who does not have Ops experience is the difference in feedback loop. It’s much harder to see what has gone wrong on the CI machine compared to your local machine!
In this short guide, we will focus on the main techniques to try and answer the hot question - “How to debug GitHub actions?”
Setup fronted application with Vite & React
As an example, we will run a simple GitHub action on our front-end project. GitHub action will be the bare minimum and will execute some open-source visual regression tests on a single webpage.
Let’s create a simple Vite project:
npm create vite@latest
After selecting the following parameters our code shall be bootstrapped:
✔ Project name: … vite-project
✔ Select a framework: › React
✔ Select a variant: › TypeScript
We only need to install dependencies and run our application:
npm install && npm run dev

Now let’s add a basic testing setup so we have something to work with in our GitHub Action.
Setup open-source visual regression testing with lost-pixel
To get started we need to install the library & generate the basic config:
npm install lost-pixel && npx lost-pixel init-ts
Let’s modify the config so it can test plain web-pages:
import type { CustomProjectConfig } from "lost-pixel";

export const config: CustomProjectConfig = {
  pageShots: {
    baseUrl: "localhost:5173",
    pages: [
      {
        path: "/",
        name: "app",
      },
    ],
  },
  generateOnly: true,
  failOnDifference: true,
};
While running our frontend application let’s execute lost-pixel tests locally:
npx lost-pixel update
This command will crawl all of the listed pages(just one / page in our case) and create baseline snapshots that all the future snapshots will be compared to.
This is the expected output of this command:
Version: 3.16.0
---
✅ Found config file: /Users/d-ivashchuk/projects/lost-pixel-workspace/blogposts/vite-gh-actions/lostpixel.config.ts
🚀 Starting Lost Pixel in 'generateOnly' mode
Running lost-pixel in update mode. Baseline screenshots will be updated
📂 Creating shot folders
📸 Creating shots
Removing 0 files from .lostpixel/current/
Removing 0 files from .lostpixel/difference/

=== [Page Mode] http://localhost:5173 ===

Prepared 1 pages for screenshots on chromium
[1/1] Taking screenshot of 'app ' (app)
[1/1] Screenshot of 'app' taken and saved to '.lostpixel/current/app.png' in 2.669s (app)
Screenshots done!
Creating shots took 3.142 seconds
🔍 Checking differences
Comparing 1 screenshots using 'pixelmatch' as compare engine
[1/1] Comparing 'app' (app)
[1/1] Baseline image missing. Will be treated as addition. (app)
Comparison done!
Removing 0 files from .lostpixel/baseline/
👋 Exiting process with 0 found differences & 1 baselines to update
Now we have our frontend tests set up as well, let’s try to run this on GitHub Action.
Setup GitHub
To run everything that we were already able to run locally we need to create a GitHub Action declaration file in the root of the workspace .github/workflows/visual-testing.yml:
on: [push]

jobs:
  build:
    runs-on: ubuntu-latest

    steps:
      - name: Checkout
        uses: actions/checkout@v3

      - name: Setup Node
        uses: actions/setup-node@v3
        with:
          node-version: 18.x
          cache: "npm"

      - name: Install dependencies
        run: npm ci

      - name: Build Vite app
        run: npm run build

      - name: Run Vite app
        run: npm run start &

      - name: Lost Pixel
        uses: lost-pixel/[email protected]
The above code pulls the code of the repository on the CI, installs dependencies, builds our application, serves it, and runs lost-pixel on top of it.
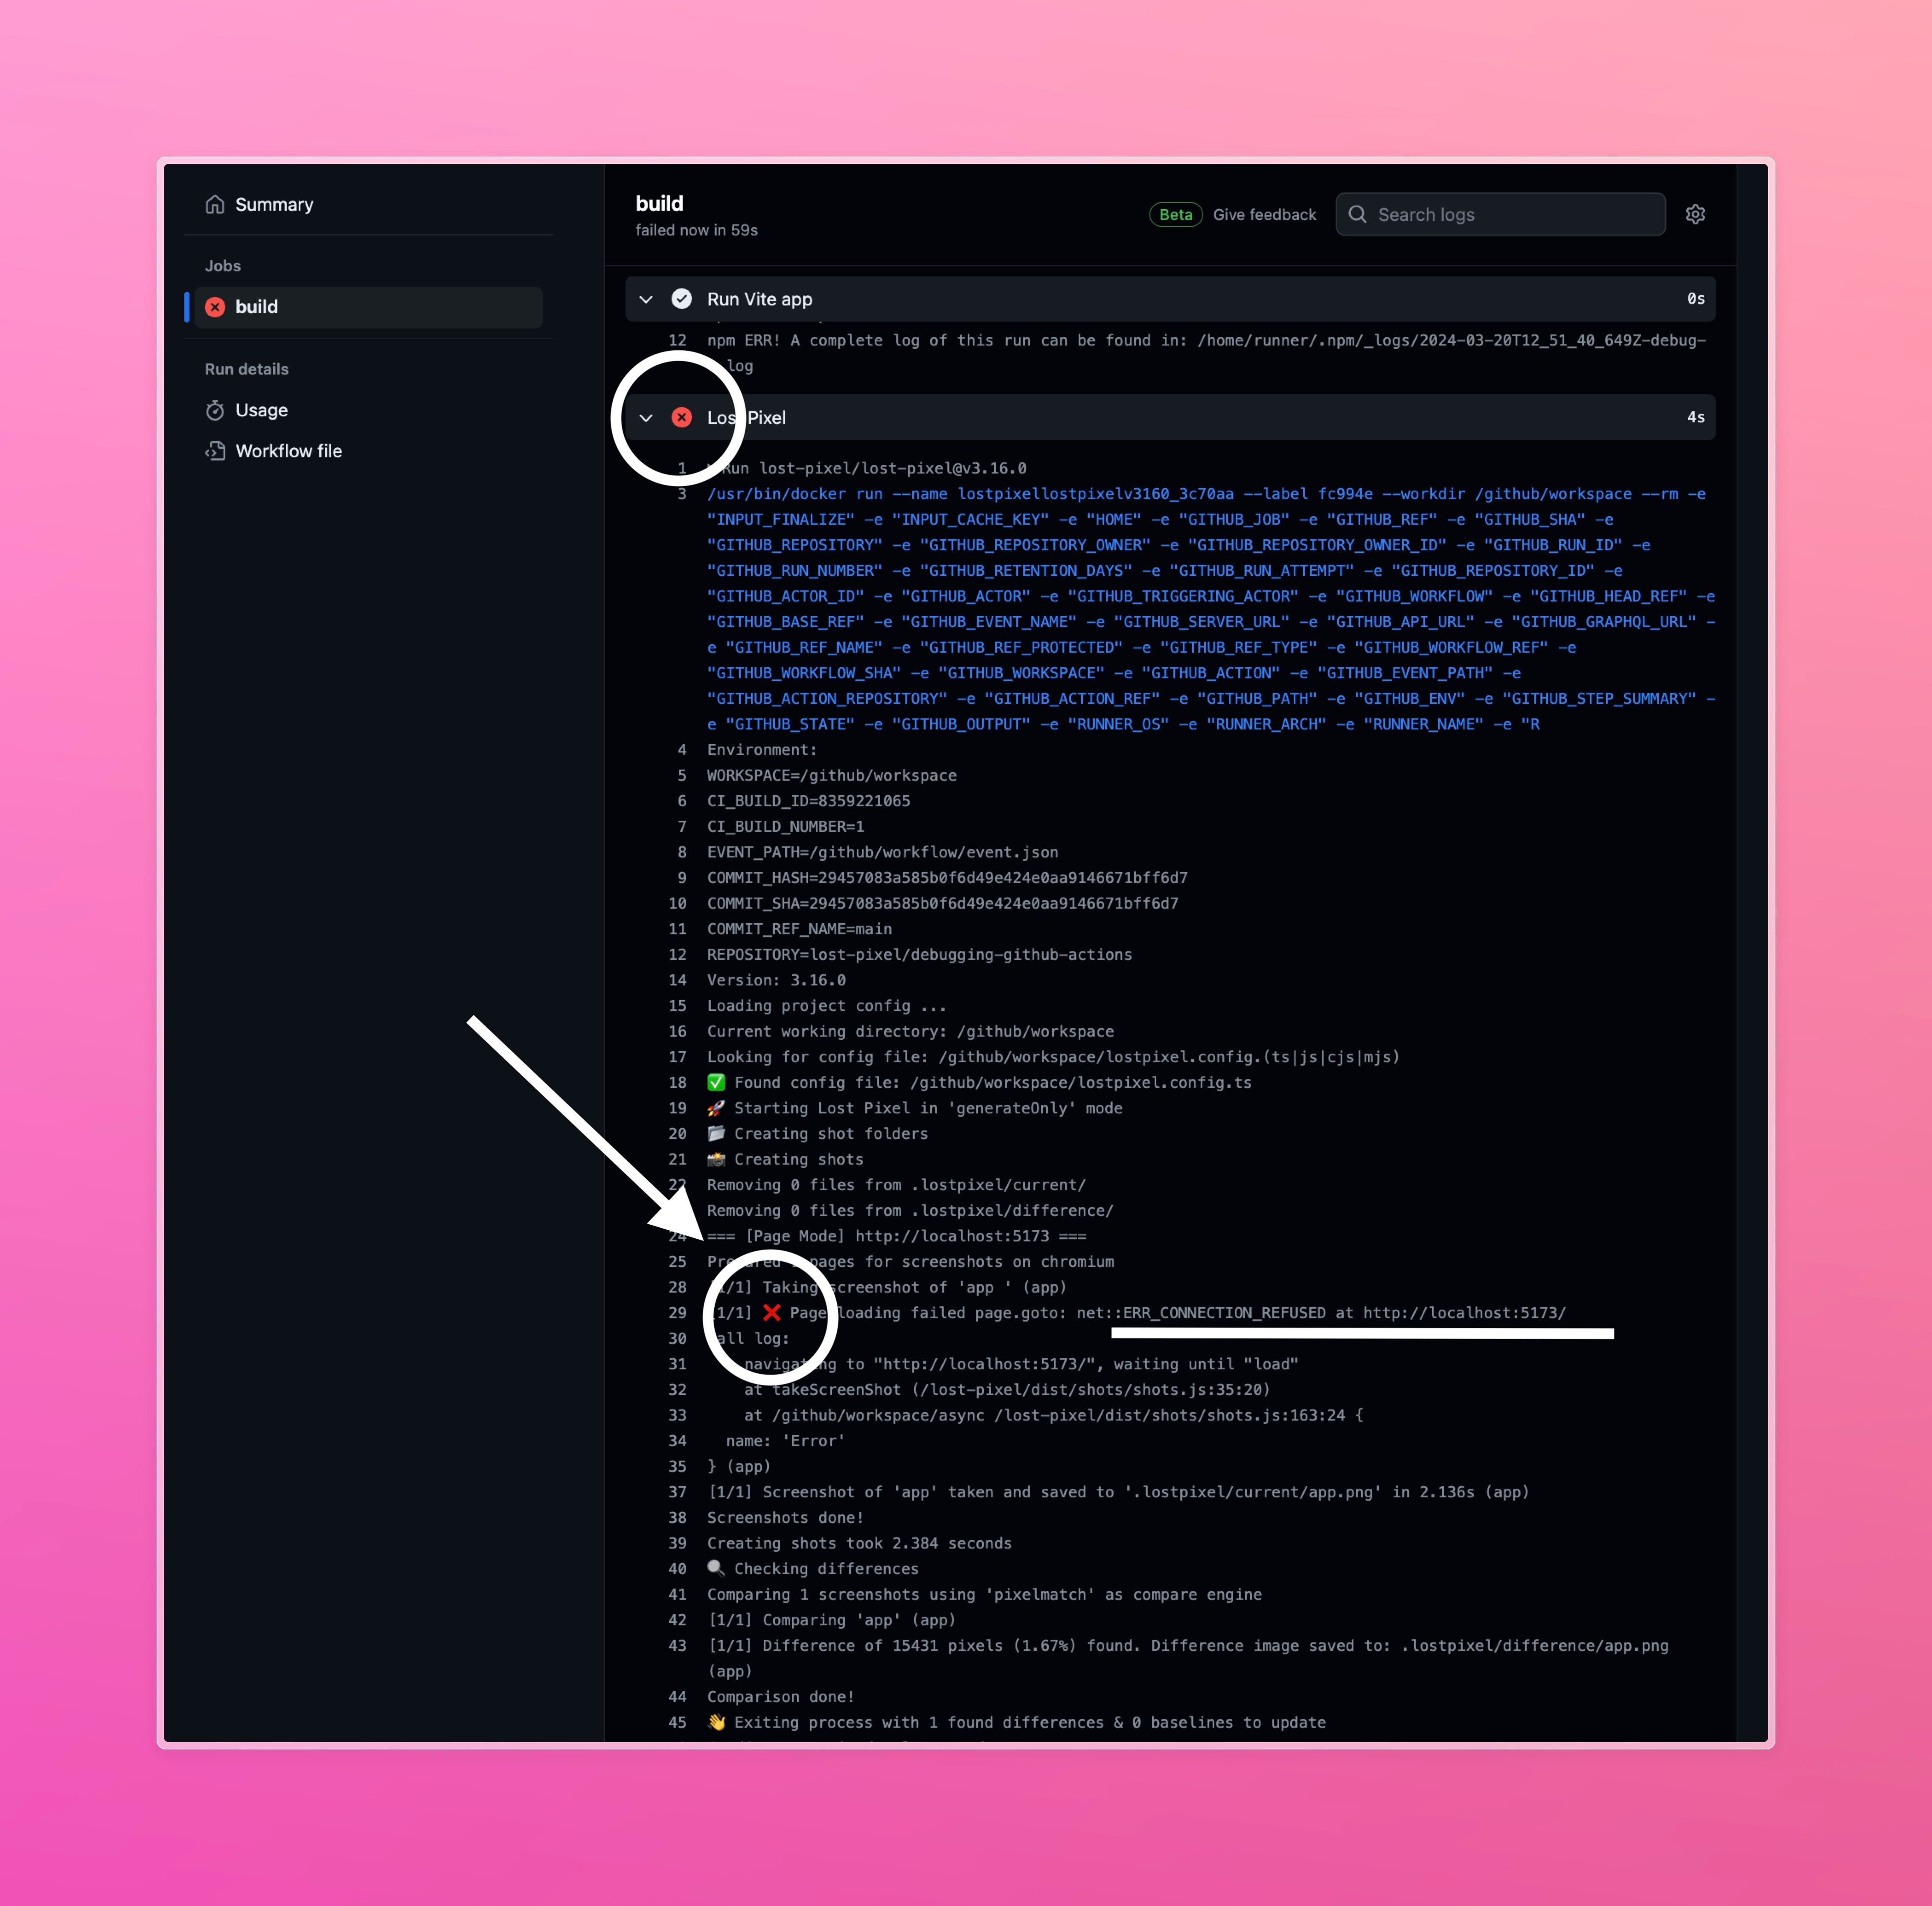
It is a literal match of what we have done locally, but now it is automated. If you push this code and your GitHub action runs you will see that lost-pixel step fails with the following error:

That’s not something that we expect and at this point, we have no clue what is going on. Let’s finally see the easiest way of debugging GitHub actions.
Debugging GitHub Actions
When it comes to debugging something(CI or locally, does not matter) two things matter the most:
- having a plan to debug
- having a tool to execute the plan
In our case we already have a good deal of understanding of what’s going on from the error that we saw on our CI(GitHub Actions):
[1/1] ❌ Page loading failed page.goto: net::ERR_CONNECTION_REFUSED at http://localhost:5173/
Our first guess is that something is wrong with our frontend application and we need to verify it. Locally you would just go to localhost:5173 and see it for yourself. On CI it is trickier and we need to be smart with the tooling, as there is no way for us to open something that runs on the GitHub Actions in our browser.
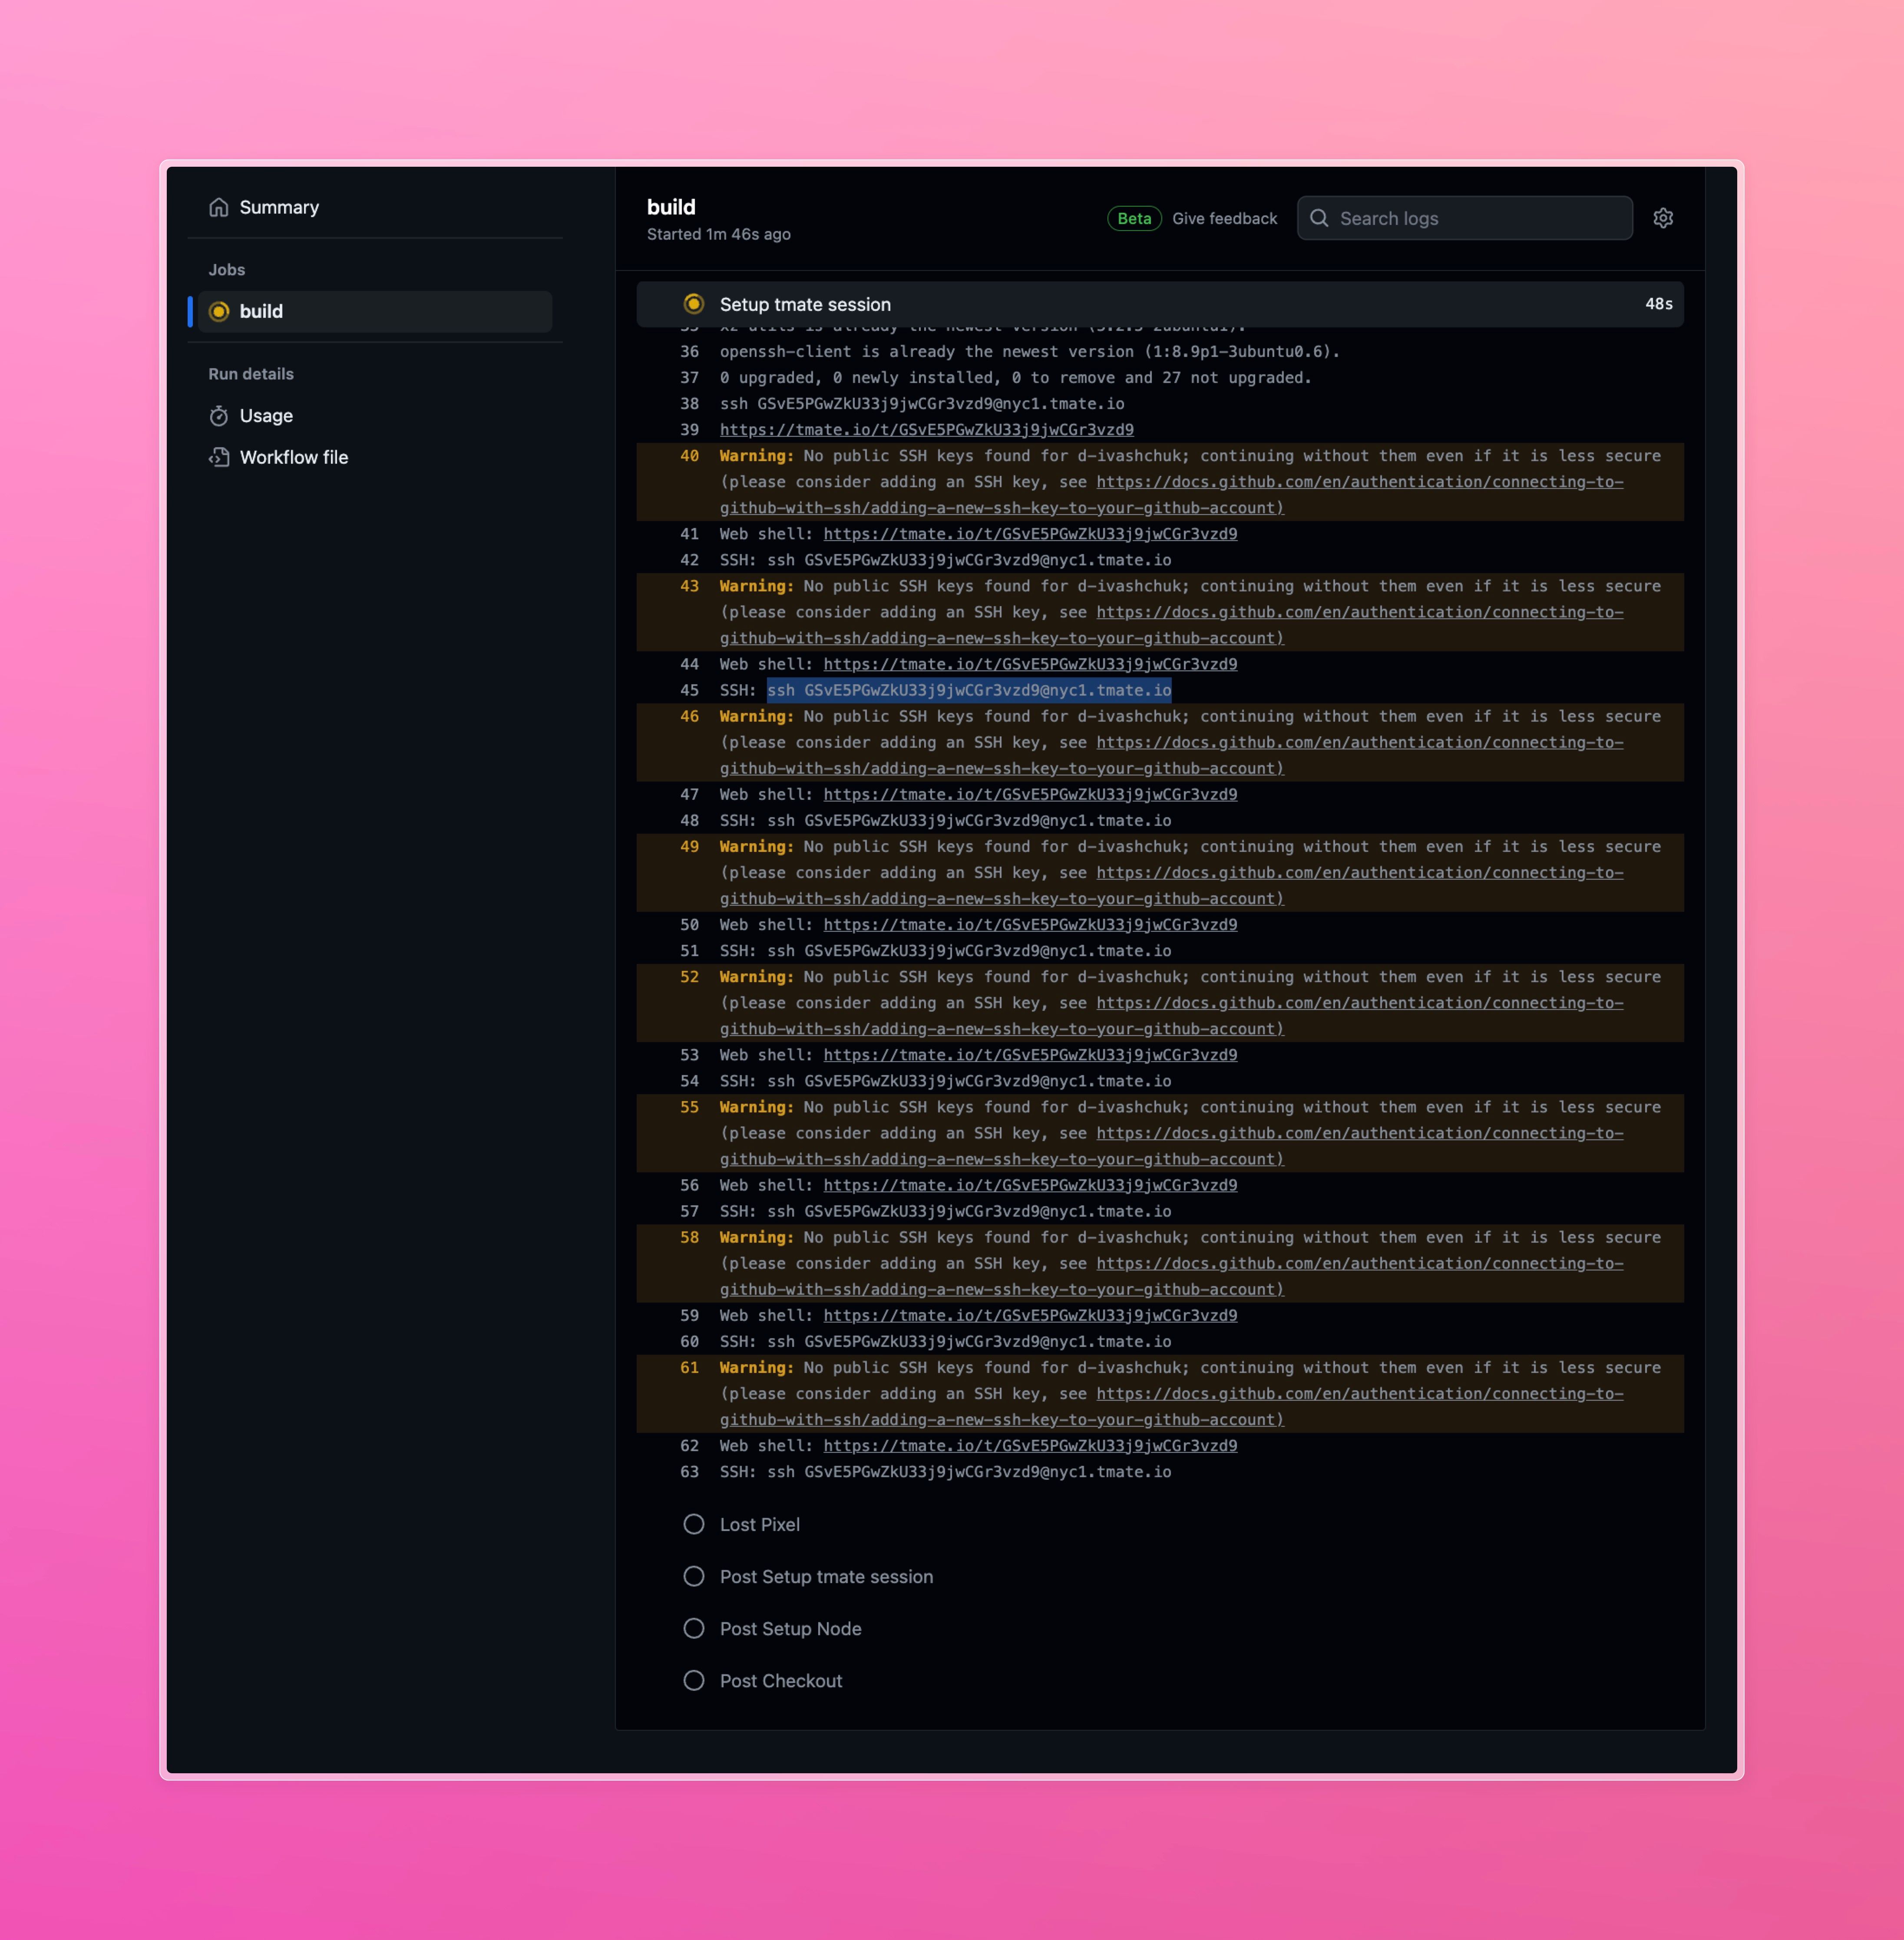
The go-to method of debugging GitHub Actions is tmate. With tmate we can connect to our running Action terminal and see what is going on there by executing some simple commands!
As the problem occurs between Vite run & lost-pixel run let’s strategically place a tmate step in our Action yml file:
on: [push]

jobs:
  build:
    runs-on: ubuntu-latest

    steps:
      - name: Checkout
        uses: actions/checkout@v3

      - name: Setup Node
        uses: actions/setup-node@v3
        with:
          node-version: 18.x
          cache: "npm"

      - name: Install dependencies
        run: npm ci

      - name: Build Vite app
        run: npm run build

      - name: Run Vite app
        run: npx serve dist &

      - name: Setup tmate session
        uses: mxschmitt/action-tmate@v3

      - name: Lost Pixel
        uses: lost-pixel/[email protected]
Tmate will stop our GitHub Action from running further and expose an ssh command that you could use to connect from your terminal to the GitHub Action running container:

ssh [email protected]
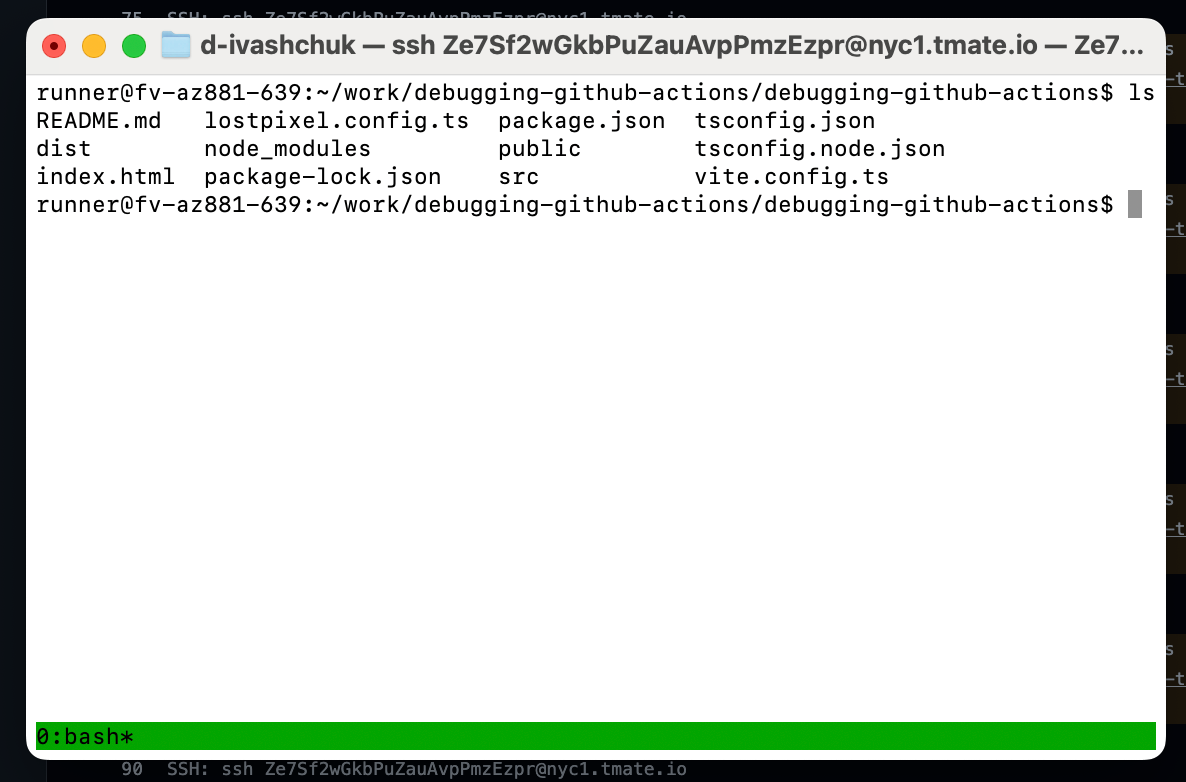
It will look similar to the above command, after executing it you should be in and able to debug your Action properly.
You will also have an option to copy a URL of Web Shell that will allow you to connect directly from your browser.

If you run ls command you should see that Vite has been successful in building our application indeed as we have dist folder listed.
Let’s see if we can access anything served(we are looking for our frontend application) by executing the following command:
curl http://localhost:5173
This should return correct html for the page meaning that our app is running just fine, but lost-pixel has trouble accessing it.
This gives enough clues to investigate the docs of the GitHub actions and lost-pixel to see that we need to change the localhost to the IP address of the local network running on GitHub actions. There is also an answer on Stack Overflow that can lead us in the right direction! Lost Pixel action running in docker simple couldn’t reach localhost it needed a concrete IP address in that case.
Let’s fix it in our lost-pixel.config.ts
import type { CustomProjectConfig } from "lost-pixel";

export const config: CustomProjectConfig = {
  pageShots: {
    baseUrl: "http://172.17.0.1:5173",
    pages: [
      {
        path: "/",
        name: "app",
      },
    ],
  },
  generateOnly: true,
  failOnDifference: true,
};s
This resulted in the successful run of our CI, meaning we fixed the bug on the CI with the help of tmate debugging.
Afterthoughts
GitHub Actions is a powerful tool that allows you to write your CI/CD pipelines in declarative plain language. When it comes to debugging - tmate is one of the most popular options due to the simplicity & enjoyable developer experience it brings.
When it comes to the alternatives to tmate, there is another great debugging tool that you could check out. It is called act and it allows you to run GitHub Actions code on your local machine making debugging even easier. It has its own limitations and some learning curve but overall it is another tool you should use if you can’t fix the CI bugs by connecting directly into the running action with the tmate.

About Dima Ivashchuk
Hey, I'm - Dima the co-founder of Lost Pixel. I like modern frontends, building stuff on the internet, and educating others. I am committed to building the best open-source visual regression testing platform!
